Five hospitality tech trends are reshaping MENA F&B in 2026. The gap between the operators adopting them and those waiting is becoming visible in the numbers. That’s not because the technology is new but because consistent implementation compounds: higher retention, better cover yields, and guest data that actually informs decisions.
This article covers each of the five trends in practical terms: what the evidence shows, where MENA operators stand today, and what the operators who are pulling ahead are doing differently. This is not a forecast; these patterns are already showing up across the region in how restaurants book, seat, serve, and retain guests.
Trend 1: AI Moves From Pilot to Everyday Operation

The headline numbers are striking: 26% of US restaurant operators are now using AI tools in their daily operations (National Restaurant Association, State of the Industry 2026). The more useful number is the directional one: 82% of global executives plan to increase their AI investment in the next fiscal year (Deloitte, 2025).
In MENA, the pattern is consistent with the broader GCC trajectory: 84% of GCC organizations report having adopted AI to some degree, yet only 11% are what McKinsey classifies as “value realizers” — operators who have moved beyond adoption to measurable return (McKinsey GCC, 2025). The adoption rate is high. The execution gap is higher.
The practical applications in F&B are not abstract. Menu engineering informed by real-time popularity data. Guest feedback routed to the right team within hours rather than weeks. Marketing campaigns that segment by occasion, season, and spend profile rather than by generic audience buckets. The technology to do this exists in most modern restaurant management platforms. The gap is in whether operators have built the workflow to use it.
AI in restaurant operations does not replace the team. It removes the manual layer that sits between the data and the decision.
Trend 2: Guest Data Becomes the Foundation of Marketing

Loyalty program members now represent 39% of all restaurant visits. Meanwhile, loyalty-driven traffic grew 5% while overall restaurant traffic fell 2% (Circana, 2025). That divergence is significant. It means operators with a functioning loyalty and guest data program were growing while most others were contracting.
The mechanism is not complicated. Guests who are known — by name, by occasion, by preference, by visit history — return more often and spend more per visit. McKinsey’s research puts personalization-driven revenue lift at 10-15% across retail and hospitality sectors. Among top-performing operators in the US, 37% of all transactions now come from loyalty members (Paytronix, 2024).
In MENA restaurants, the data gap is structural. Most operators have reservations data, point-of-sale data, and marketing data sitting in separate systems. Guests who booked via a third-party platform are invisible in the CRM. Guests who visited five times and spent consistently are treated identically to someone who came once on a voucher.
The operators closing this gap are not building complex data infrastructure. They are using a unified guest profile — one record per guest, updated at every visit — to decide who gets which message, when. The full guest journey, from first search to repeat visit, and where most operators lose value along it, is covered in detail here. For a look at how every booking and service touchpoint feeds into that record, see this piece.
Trend 3: Direct Booking Channels Are Outperforming Third-party Platforms

65% of consumers go directly to a restaurant’s website when they want to make a reservation (Toast, 2025). The audience for direct booking is already there. The question is whether the operator is ready to capture it, or whether they are sending that traffic to a third-party platform and paying for the privilege.
The cost of third-party dependency has become clearer in 2026. For example, OpenTable’s current pricing starts at $149 per month on its Basic tier, with per-cover fees that, at typical volume, can add $2,000–$3,000/month on top of the base tier.
In April 2026, OpenTable updated its contracts to require restaurants to designate it as their primary reservation management system, as per Restaurant Dive / Restaurant Business (April 2026). Primary designation means the majority of bookings flow through the platform and with them, the guest records: contact details, visit history, dining preferences. An operator can view that data inside OpenTable’s dashboard, but the underlying records sit in OpenTable’s infrastructure, not in a system the operator controls directly. For restaurants that want to run their own loyalty marketing, switch platforms, or export a complete guest history, that arrangement creates a dependency that is difficult to unwind.
The industry context adds weight to this. DoorDash’s $1.2 billion acquisition of SevenRooms in June 2025 was the clearest signal yet that the platforms aggregating booking data intend to own the guest relationship at scale. Operators who build their own direct booking infrastructure are building a channel and a guest record that they control. For a comparison of how different platforms handle booking data ownership, check out our Compare Hub.
Every direct booking adds to a guest record the operator owns. Every third-party booking does not.
Trend 4: Platform Consolidation Is Replacing Fragmented Tool Stacks
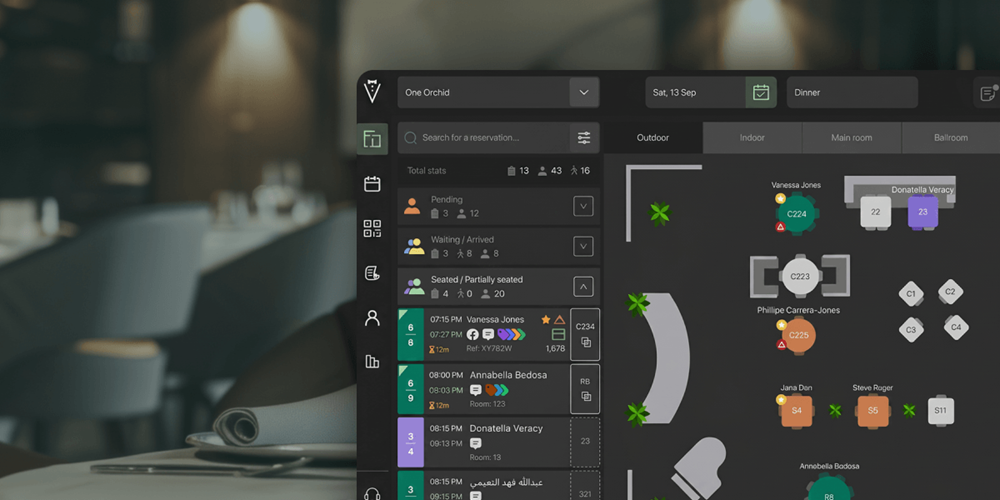
76% of restaurant operators say technology gives them a competitive edge. Only 13% describe themselves as leading edge (NRA Technology Landscape, 2024). The gap between those two numbers is not a technology problem. It is an integration problem.
85% of operators cite integration with other systems as the primary driver when they evaluate a new point-of-sale platform (Hospitality Technology, 2024). The frustration is familiar: a reservations system that does not talk to the POS; a loyalty program that cannot read booking data; a marketing tool that operates from a static export rather than a live guest record.
The practical cost of this fragmentation is not just operational friction. It is the absence of a unified guest view. An operator cannot personalize a visit if the front-of-house team is looking at a booking record with no purchase history. They cannot measure the return on a loyalty campaign if the data lives in a system that does not connect to the one tracking redemption.
It is why 97% of multi-unit operators run the same system across all their venues (FSR Magazine / TouchBistro, 2025). Consistency at group level is not an aesthetic preference; it is what makes group-level insight possible. The shift in 2026 is less about switching platforms and more about rationalizing: fewer tools, higher data connectivity, one source of truth per guest.
For a practical view of what consolidation looks like in a restaurant tech stack, read this piece on integrations.
Trend 5: Revenue Management Moves From Hotels Into Restaurants

Revenue management — the practice of using data to optimize when, how, and to whom capacity is sold — has been a hotel discipline for decades. It is arriving in restaurants, and the evidence that it works is older than the current conversation suggests.
The foundational model for restaurant revenue management is RevPASH: Revenue Per Available Seat Hour. Developed at Cornell in 1998 by Sheryl Kimes, the framework translates hotel yield management principles into F&B terms. A 2002 case study applying RevPASH principles at Chevy’s Fresh Mex produced a 5.1% increase in revenue — approximately $3,780 per week, per location.
More than 70% of restaurant executives have acknowledged limited capability in revenue growth management (McKinsey). The tools now available make this less of an analytical gap and more of a discipline gap.
Hotel F&B revenue per occupied room grew 3.8% in H1 2025 (CBRE Hotels). The operators applying revenue management discipline to their F&B are already seeing it in the numbers.
What This Means for Gulf Operators in 2026
These five trends are not independent. AI enables personalization at scale. Personalization is only possible if booking and visit data is direct, owned, and unified. A unified guest record requires platform consolidation. Consolidated platforms give operators the data to run revenue management with real precision.
The operators working on all five are building advantages that compound. The ones waiting to start are not holding steady; they are falling further behind the operators who are not waiting.
For Gulf restaurants, 2026 is not a year to watch these trends from a distance. It is a year to decide which of them you are implementing and to build the infrastructure to make each one measurable.