The opportunity to improve your restaurant profit margin is usually already inside your operation. We know, when margins tighten, the instinct is to adjust the menu. A price increase feels like a clean solution: revenue goes up, gross profit improves. But in practice, it moves the problem rather than solving it. Raising prices on an operation that has unmanaged no-shows, inconsistent food cost, and labor hours that don’t flex with covers doesn’t fix the margin. It temporarily offsets it.
So here are five levers — no-shows, food cost, labor by shift, RevPASH, and upsell per cover — that account for most of the margin gap in full-service venues. None of them require a price change.
No-Shows: The Margin You’re Giving Away Before the First Cover

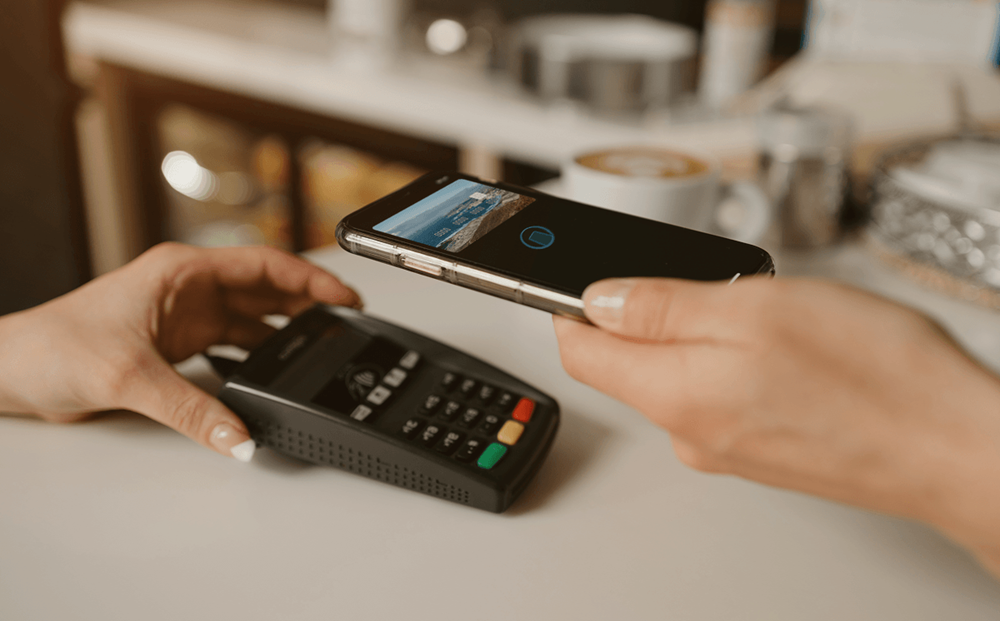
No-shows represent the cleanest form of margin loss in a restaurant. The cover was held, staff was scheduled, and in many cases food was prepped. None of those costs disappear when the table sits empty.
The lever is deposit and confirmation settings. Aim for:
- A minimum 80% rate for deposit capture;
- A maximum 5% no-show rate.
Venues that review these rates weekly — and adjust those settings in response — consistently bring the number down over time. Venues that review it quarterly discover the pattern after it’s already cost them a full month’s margin.
A deposit doesn’t prevent every cancellation. But a confirmation sequence that fires 24 hours and again four hours before service gives the guest a clear moment to cancel and gives you a window to rebook the table. That recovered cover carries no additional acquisition cost.
Food Cost: What to Check When the Number Moves

The standard target range for food cost in full-service restaurants runs between 28% and 35%. When the number moves above your benchmark, the cause is rarely distributed evenly across the menu.
For example, a composite food cost of 33% can hide a pastry section running at 41% and a grill section running at 27%. Those are two different problems with two different solutions. A weekly review by category surfaces the variance. A monthly composite review obscures it.
When food cost spikes, check in this order:
- Supplier invoices for price changes that weren’t factored into the last menu update;
- Portion variance across the shift;
- Waste logs.
A spike almost always traces to one ingredient, one dish, or one shift’s prep pattern — not a general deterioration across the whole kitchen.
Labor Cost by Shift, Not by Month
Labor cost percentage for full-service venues typically falls between 25% and 35%. Most operators who see that number off-target look first at headcount or rates. The more useful place to start is the shift breakdown.
A labor cost that’s elevated on Wednesday lunch and on target for Wednesday dinner isn’t a staffing level problem. It’s a scheduling pattern, possibly related to minimum guaranteed hours, standing rosters that don’t flex with the cover count, or a prep commitment that makes it difficult to bring early-shift team members in later.
Each of those has a solution. A Wednesday lunch that books at 60% of Friday lunch capacity shouldn’t carry the same front-of-house staffing model. When labor is reviewed monthly as an aggregate, that kind of pattern never becomes visible. When it’s reviewed by shift each week, the adjustment is obvious before it compounds across the month.
Revenue per Available Seat Hour (RevPASH)

Revenue per available seat hour — RevPASH — shows what each seat generates across the service period. The calculation is total revenue divided by seats multiplied by hours open. The value is in tracking direction: is the number rising, flat, or falling?
When RevPASH falls, the cause is usually:
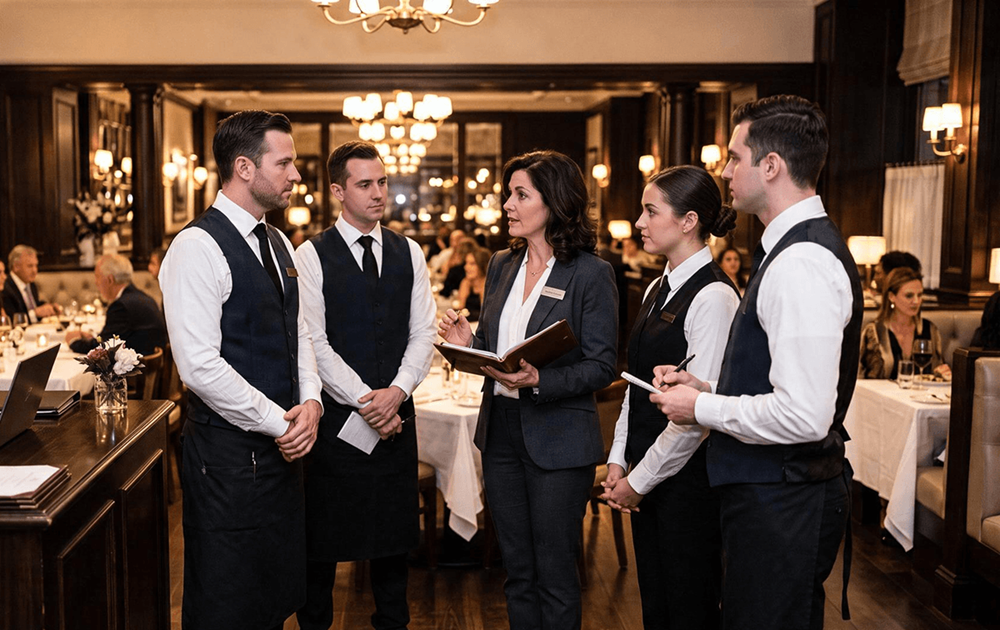
- Sitting Duration: Responds to floor communication and pacing. A well-briefed floor team can shorten average sitting time without a guest noticing.
- Table Turn Patterns: Respond to how reservations are slotted in the system and learn how to increase table turnover.
- Underperforming Daypart: Often responds to targeted in-period promotions or adjusted floor configuration for smaller groups.Set an internal RevPASH target for each daypart. The absolute figure matters less than the direction. A lunch RevPASH that tracks upward week over week — even slowly — signals that operational changes are working.
Upsell per Cover
Upsell per cover is the last margin lever before the bill arrives, and one of the few that compounds across every service. Track it in three components:
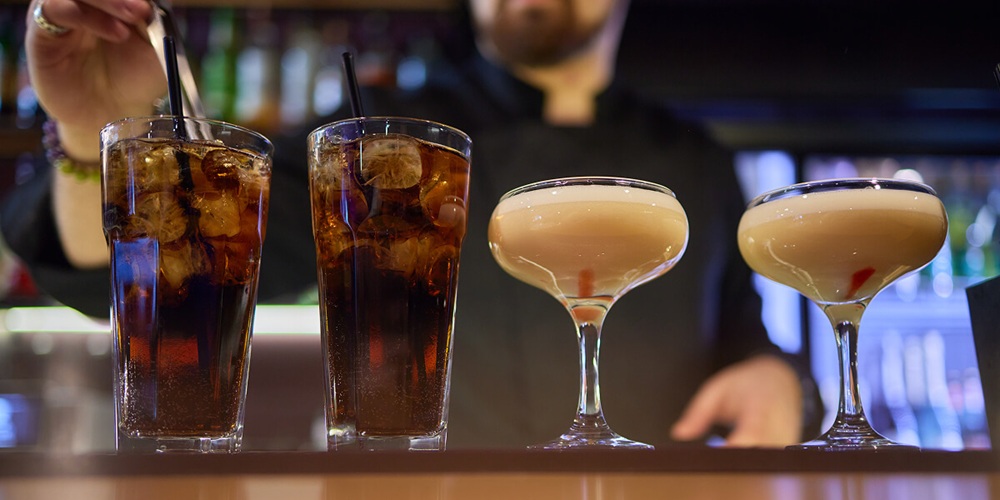
- Beverages per Cover: For full-service venues in the Gulf, a practical starting benchmark for beverage attachment runs between 1.2 and 1.8 drinks per cover, including water, soft drinks, and juice.
- Dessert Attachment Rate: The share of covers ordering at least one dessert, typically sits between 20% and 35% in full-service operations, with the figure varying significantly by concept and price point.
- Upgrade Conversion: For venues with set menus or tiered options, an upgrade conversion rate of 15—25% is a reasonable initial target for tracking direction.
These are internal benchmarks to set and track, not universal standards. The useful question is not whether your numbers match an average; it’s whether they move in response to what you do on the floor. When upsell ratios are low, the issue is almost never team motivation. It’s briefing, menu sequencing, and whether staff know which items to lead with before the table orders.
None of these five levers require a price increase. They require a review cadence — weekly rather than monthly — and the operational visibility to act on what the numbers show.
Most of the data is already in your reservation and POS systems. No-show rate, deposit capture, food cost by category, labor cost by shift, and RevPASH are all trackable with the tools most full-service venues already run. The gap is usually in review frequency, not data availability.
For a broader look at revenue strategy across your operation, our 2026 guide to improving restaurant sales covers the commercial side alongside the operational one.
Servme’s reservation platform tracks no-show rate, deposit capture, and covers data across your shifts — giving your team the weekly visibility these metrics require.
Book a free demo here to see how it works for your venue.